Navigation:
Intro to Data Collection
Data collection allows us to gather information about a specific behavior to better understand when, where, and why it is occurring. It is an objective method of measurement that can be used to shape and guide our decisions as we make customized plans for our students.
Data also allows us to understand how a behavior changes over time, and how our student is growing and improving from their baseline. When we understand a behavior and create an intervention for it, data shows us whether or not our plan is working.
While our view of a student's behavior may be biased or subjective, our data tells the true story.
What Do I Collect Data On?
To start collecting data, pick a problem behavior that you wish to change. Focus on one to two behaviors at a time. Make sure this behavior is clearly defined and that it is observable and measurable. Any person observing your student should be able to note the occurrence of the behavior based on your objective definition.
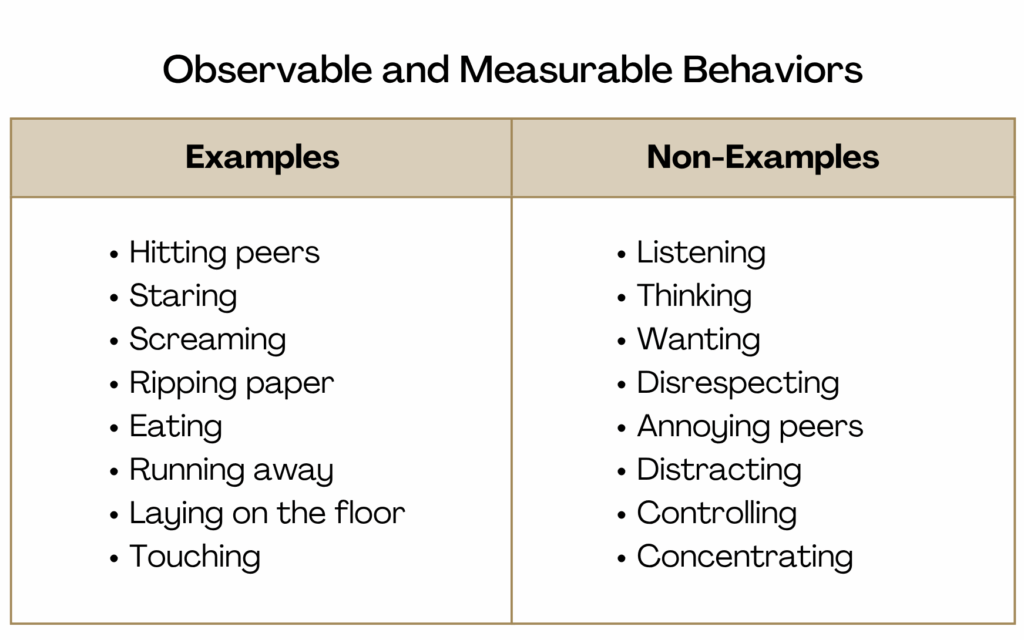
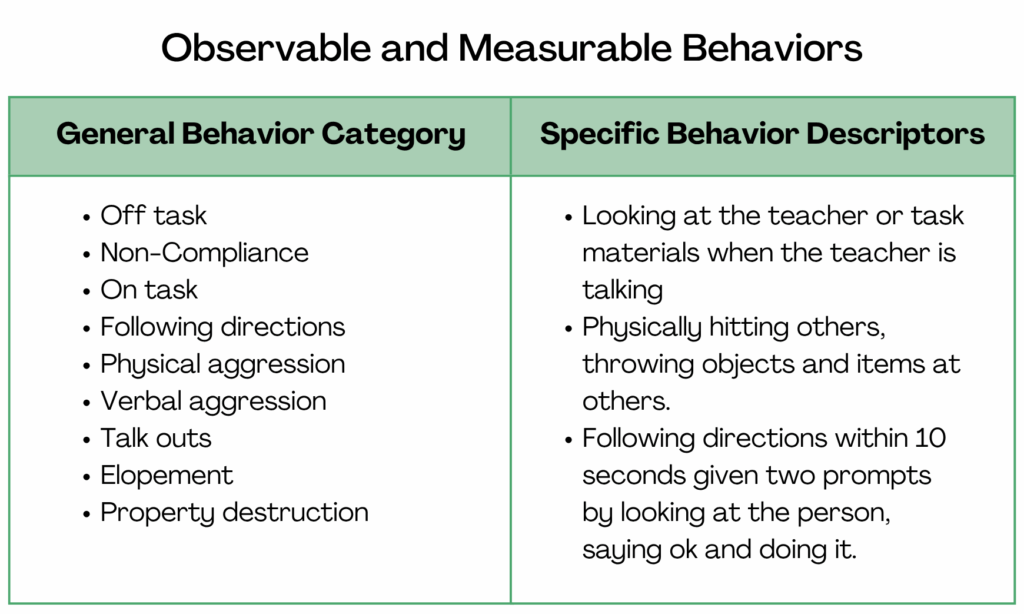
When defining the problem behavior, include context and details that go beyond a simple one-word descriptor such as "aggression" or "noncompliance." A good definition includes both a general behavior category and specific behavior descriptors.
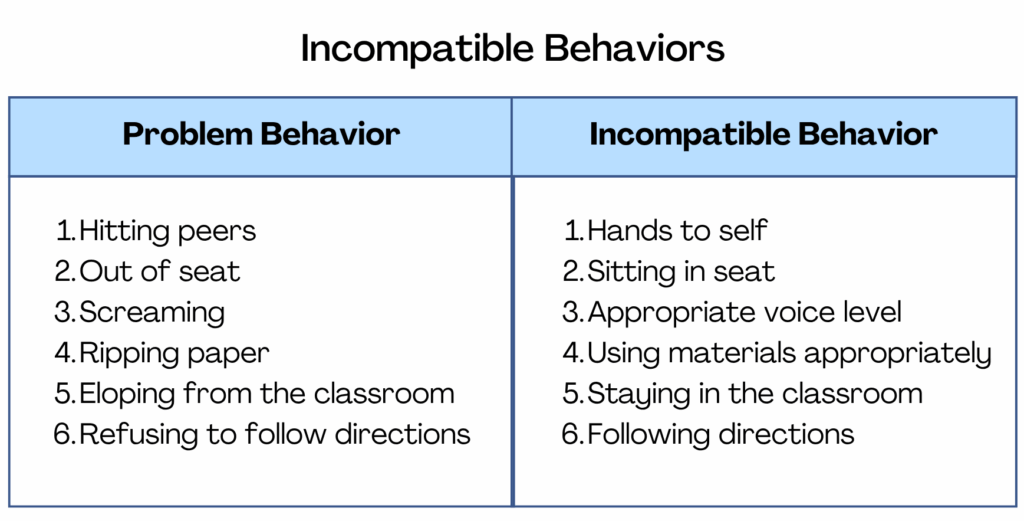
In addition, you may wish to track an incompatible behavior alongside each problem behavior. This is a behavior that cannot be performed while the student is already engaging in a problem behavior. For instance, if a student is often refusing to follow directions, then an incompatible behavior to track could be "following directions the first time."
Types of Data Collection
There are several different ways to collect data, and different methods work better for different behaviors. View the types of data collection below to decide which methods are the best fit for your student's behavior(s).
1. Frequency
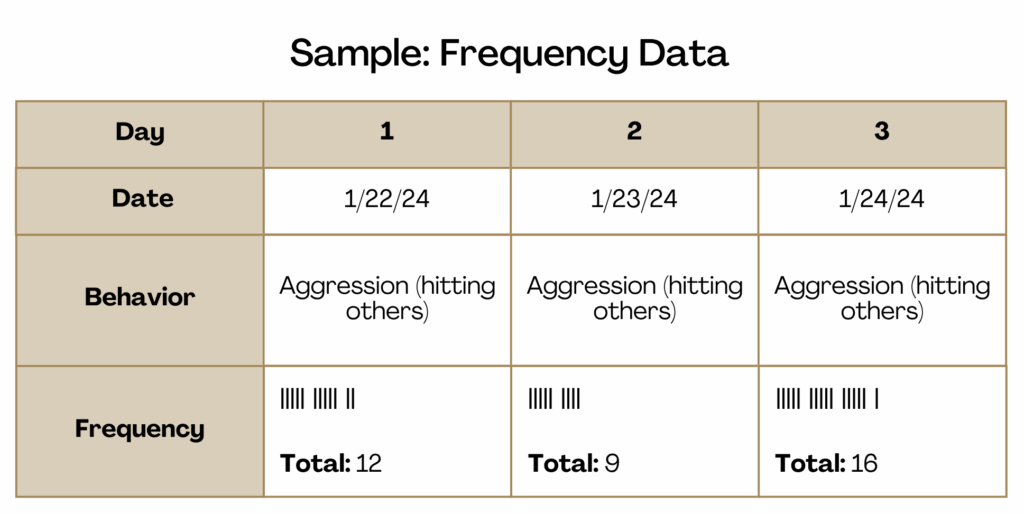
Frequency data counts how many times a target behavior occurs during a designated period of time. To collect this type of data, simply record a tally mark each time the behavior occurs.
Frequency data is recommended for behaviors that have a clear start and stop, and for behaviors that occur at a rate that an observer can keep up with. Examples of these behaviors include physical aggression, such as hitting, and shouting out. For behaviors that occur at an extremely high rate, we recommend using a click counter or collecting duration data.
2. Duration
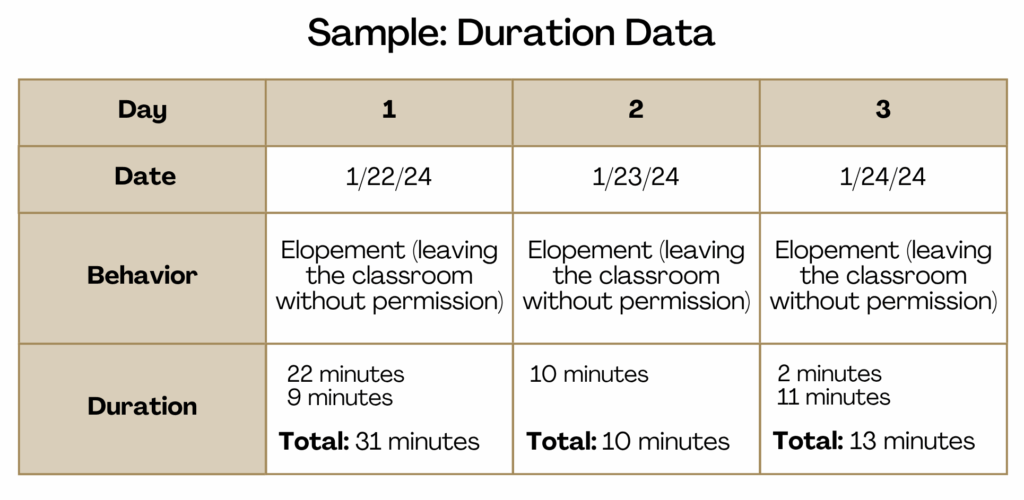
Duration data describes the length of time the target behavior occurs. To collect duration data, note the time a behavior begins and ends, and subtract the difference.
Collecting duration data is useful for behaviors that are non-discrete, such as noncompliance or elopement. This is because one occurrence of these behaviors could last anywhere from a matter of seconds, to minutes, to hours.
3. Latency
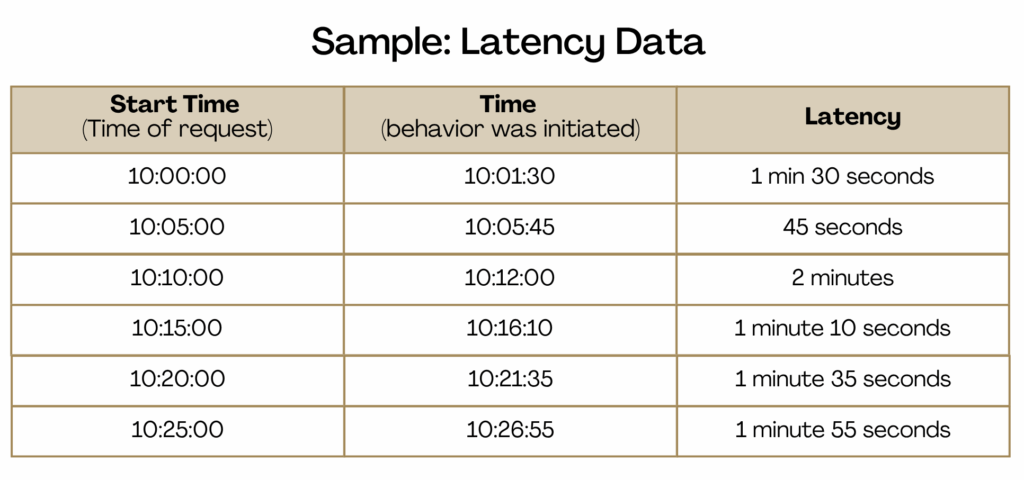
Latency data refers to the amount of time between an antecedent and when a student begins a specific behavior to understand how long it takes the student to respond.
To collect latency data, a team should already be aware of the antecedent and behavior they are monitoring. For example, you can measure the latency between a work demand and the onset of aggression. Be sure to document the type of antecedent or request that was presented, such as a specific level of prompting.
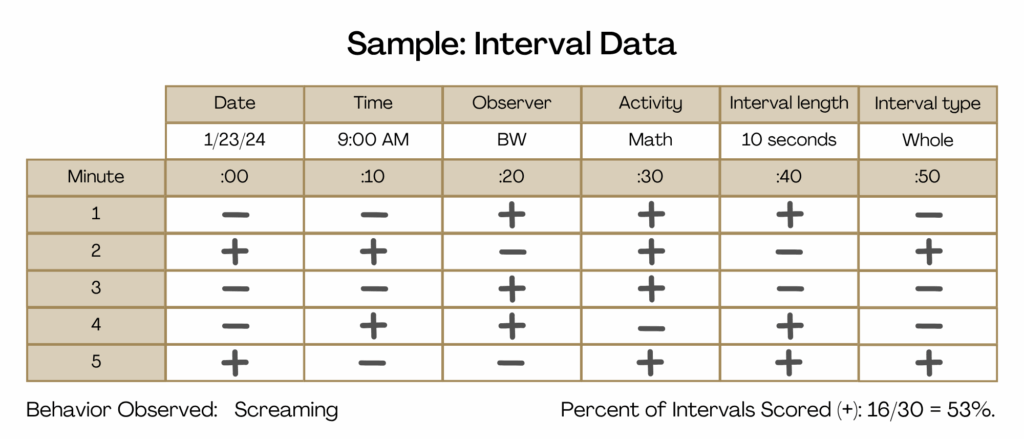
4. Interval Recording
Interval data involves dividing an observation into equal intervals of time and marking whether the target behavior is present (+) or absent (-) during each interval.
Interval-based data collection simply provides an estimate of how often the behavior is occurring and is only able to tell us the percentage of intervals in which the behavior was observed. An interval length of 60 seconds or less is recommended in order to remain as accurate as possible.
The following are different forms of interval data collection:
- Whole-Interval Recording: score the interval with a (+) if the behavior occurred for the entire interval.
- Partial-Interval Recording: score the interval with a (+) if the behavior occurred at any time during the interval.
- Momentary Time Sampling: score the interval with a (+) if the behavior is occurring at the moment that the interval ends.
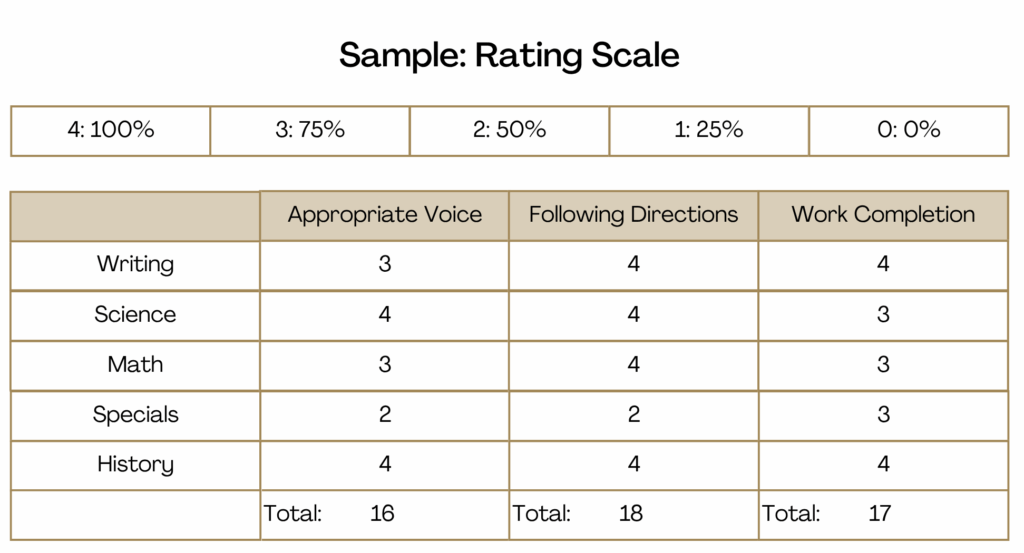
5. Rating Scales
A Rating scale is another way to estimate the overall occurrence of a behavior by using a simple Likert scale. It can track multiple behaviors at once and often tracks them over longer intervals of time, such as an entire class period. Therefore rating scales are an option that many teachers find easy to implement.
To set up a rating scale, predefine in observable and measurable terms what each point on the scale represents. Because this form of rating is subjective and different observers may disagree on their ratings, we recommend only one observer track a student's behavior over time.
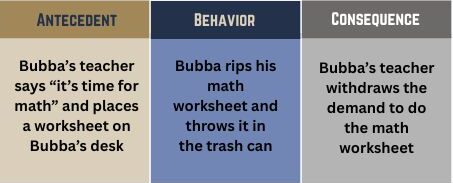
6. ABC Data Recording
ABC Data involves observing a student across various settings and taking notes about the following:
- An objective description of what the student's behaviors look like (B)
- The antecedents that come immediately before the behaviors (A)
- The consequences that come after the behaviors (C)
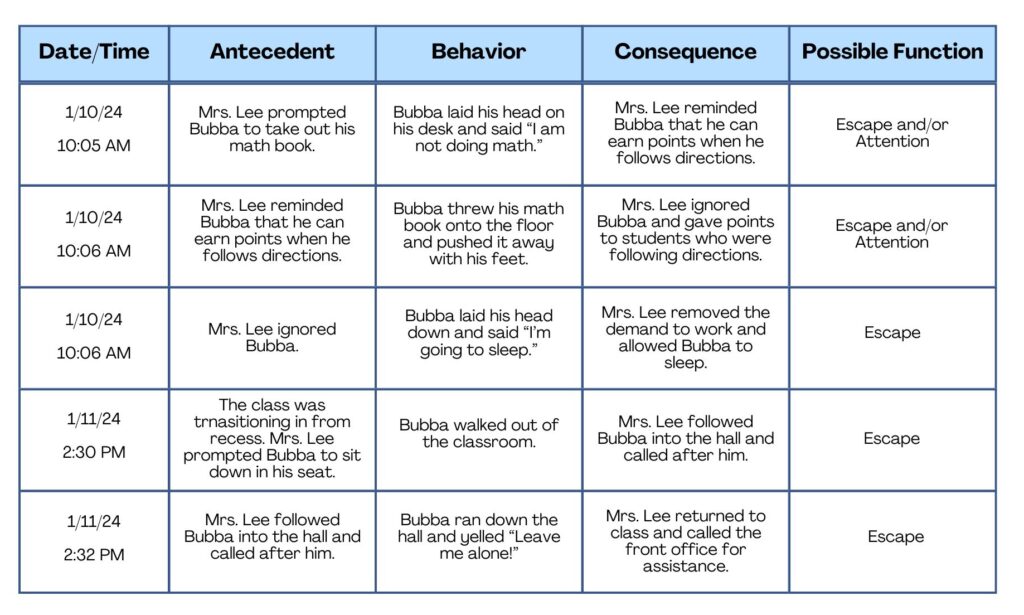
Taking ABC data across multiple days and settings can help a team identify common triggers for a student's problem behavior, as well as patterns in adults' responses to the problem behavior that may be inadvertently reinforcing it.
Below is a fictional example of ABC data collected on a student's problem behavior. Do you notice any similarities between different antecedents or consequences?
7. Scatter Plot Recording
A Scatter Plot is a visual representation of data that helps to identify trends and patterns in a student's behavior. This visual grid shows the relative frequency of one specific behavior across different times and settings, which helps a team to see when and where the behavior is most likely to occur. Times and activities are typically listed down one side of the grid while different dates are listed across the top, as shown below.
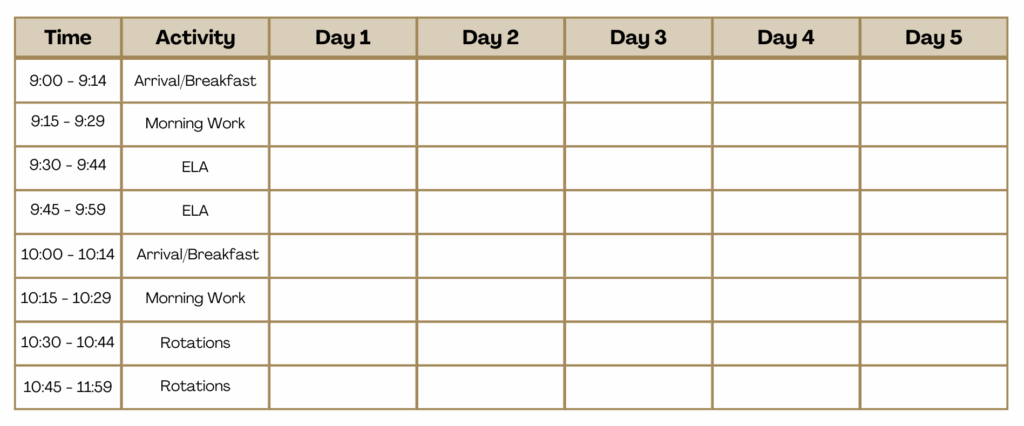
Occurrences of the target behavior are then noted in the appropriate grid space. Typically, there is a visually system or legend that identifies low, medium, and high rates of behavior.
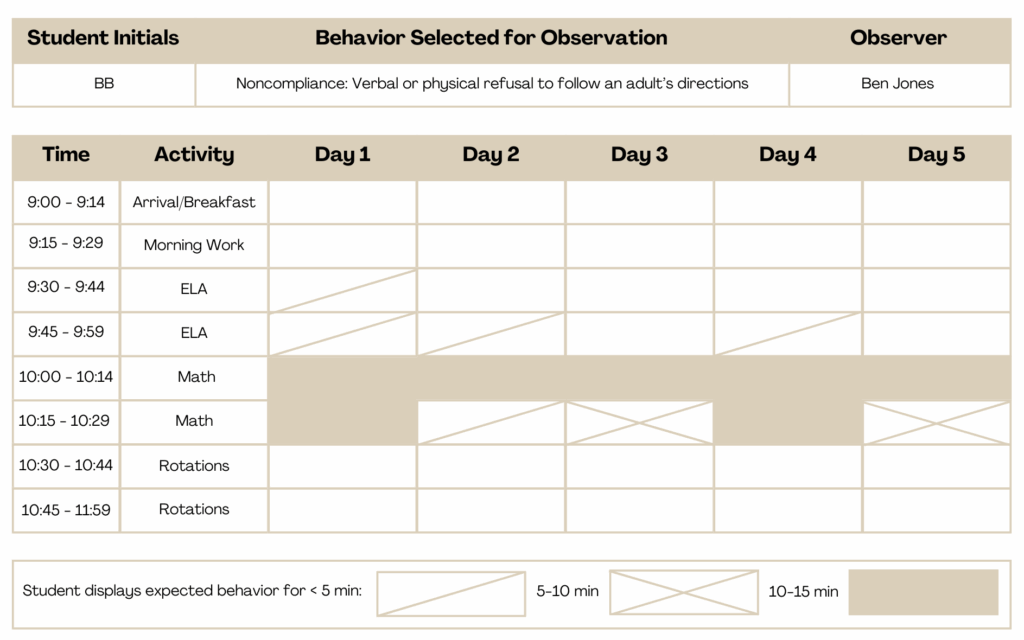
Below is a fictional example of a completed Scatter Plot recording. Are there any trends in the time of day that Bubba's noncompliance is occurring?
Graphing Your Data
Graphing data provides a visual representation of how a student's behavior is changing over time.
The easiest way to create a graph is to enter your data into a spreadsheet through Google Sheets or Microsoft Excel, and then to use that program to graph the data from your spreadsheet for you.
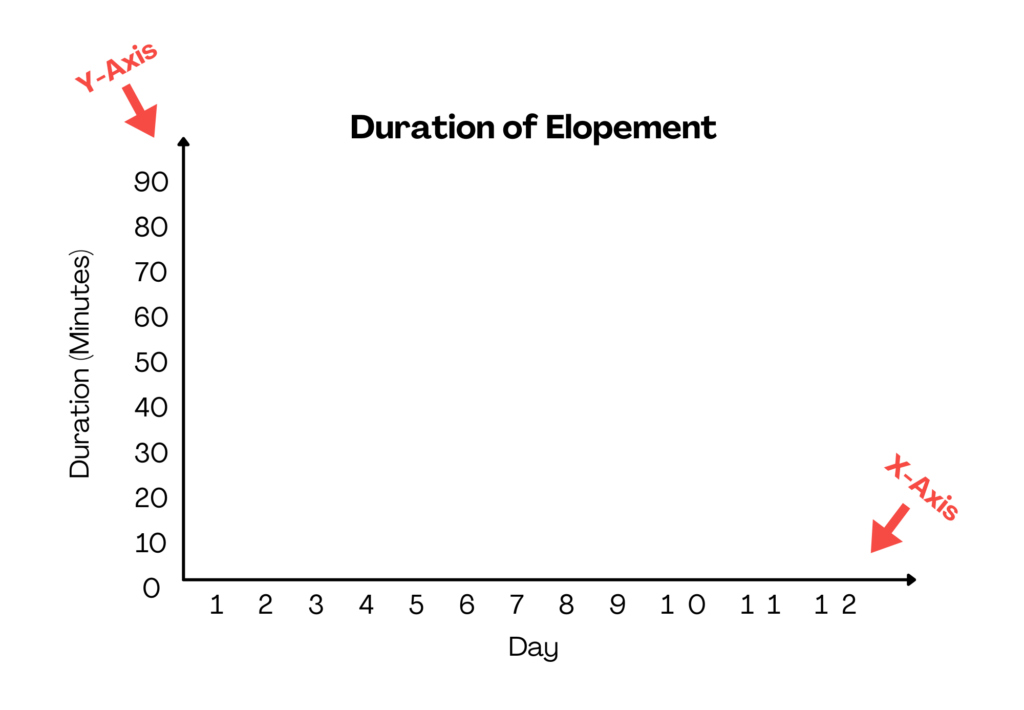
We recommend graphing your data using a line graph. The X-axis of your graph will represent a constant variable, such as the date that the data was collected, or hours of the day. This is known as the independent variable.
The Y-axis will represent the type of data you were collecting, such as frequency, duration, or latency. This is known as the dependent variable.
There are two phases of data that are relevant to analyzing a behavior's change over time: Baseline data and Intervention data.
Baseline Data
Baseline data represents a student's behavior before the beginning of a new or updated intervention. By comparing it to the data we collect during our intervention, we can see whether or not our intervention is working.
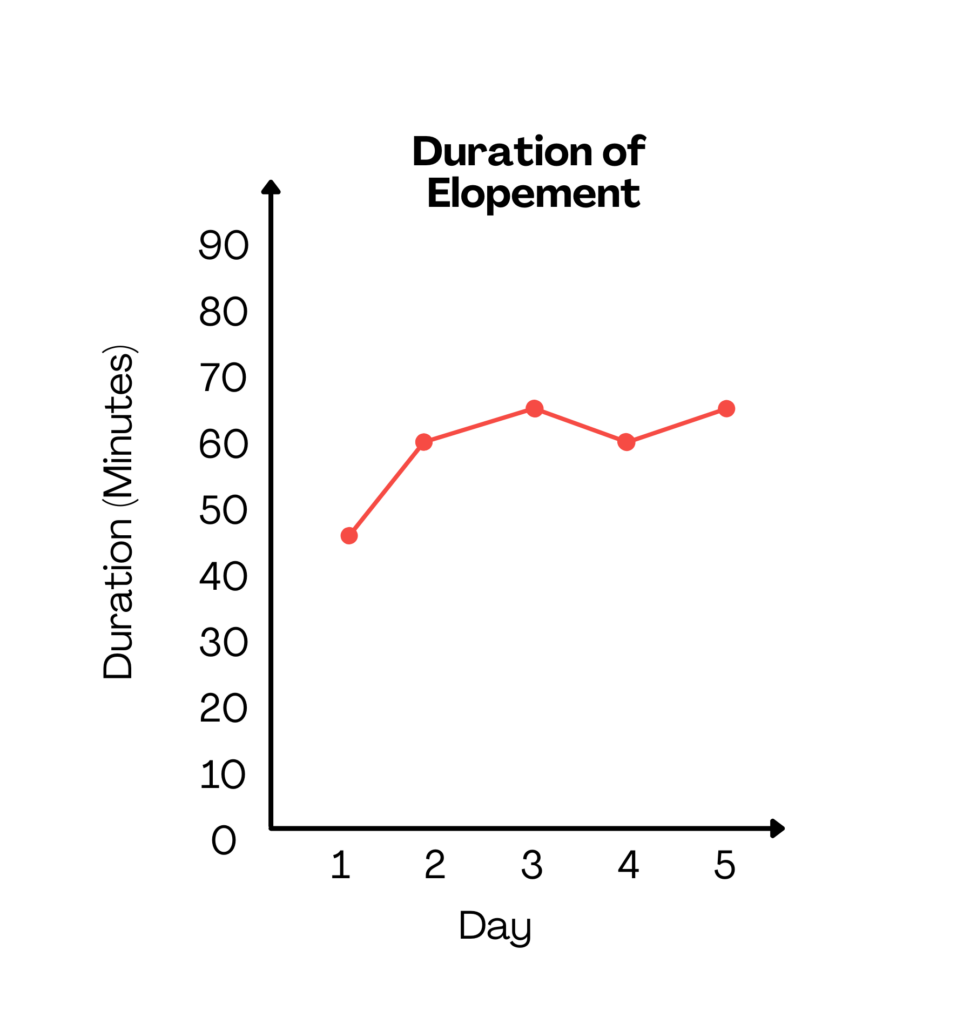
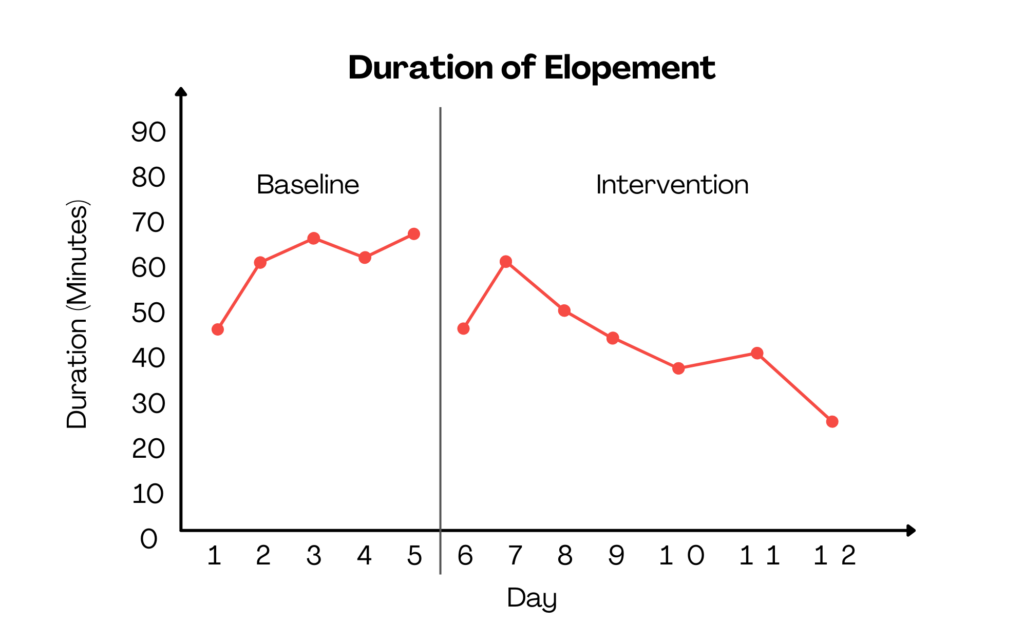
We recommend plotting at least 3 to 5 points of baseline data before beginning a behavior intervention. This helps to establish a clear baseline by showing a realistic picture of what the behavior looked like before, without the risk of outliers skewing the data. You can view an example of baseline data below.
Intervention Data
Intervention data refers to all of the data gathered on a behavior while a specific intervention is being run. Over the next few weeks, this data will be compared to your baseline data in order to determine whether the intervention is working or whether it needs to be changed or adjusted.
Once a baseline is established and an intervention is in place, mark a line straight down the graph to clearly separate the baseline phase from the intervention phase. This is known as a phase line. To the right of the phase line you will graph your intervention data, as shown below.
Analyzing Your Data
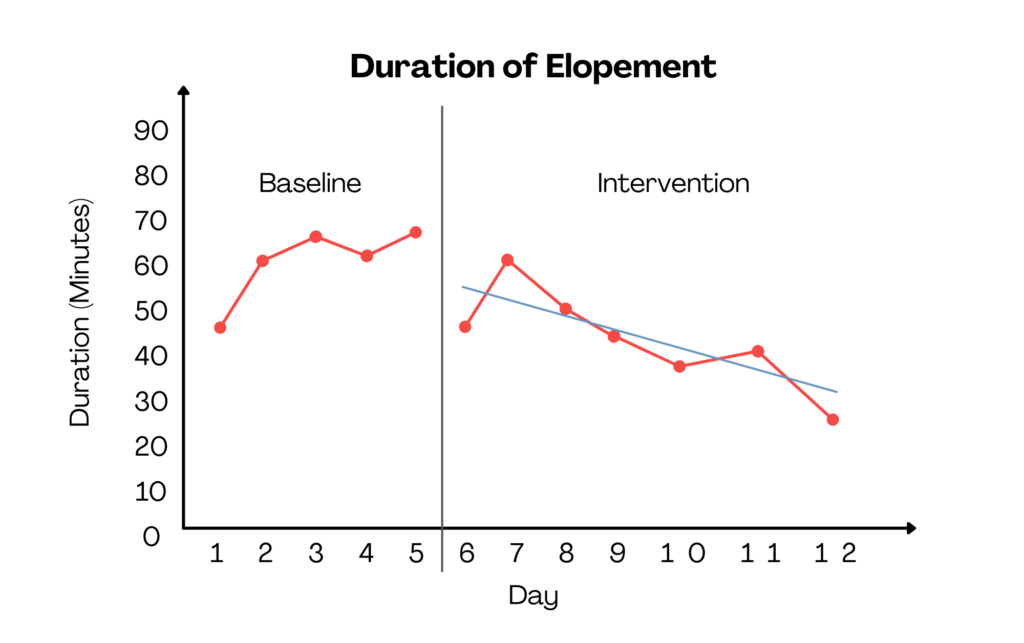
When visually analyzing your data, you should be on the lookout for a trend in the data. The trend is essentially the "direction" the data is going. Overall, does it look like the frequency, duration, etc. of the behavior is increasing, decreasing, or staying the same?
Typically, a team can identify a trend in data by simply looking at a graph. However, when there is a lot of variability in the data, it can be helpful to create a trend line in order to more accurately depict the direction the data is going. This can be done easily with either Excel or Sheets.
Reflecting on the Plan
If the data is trending downwards, the behavior intervention is most likely working. Keep running the plan and graphing as you go, and keep an eye out for a plateau in the data.
If the data is either trending upwards or in a neutral direction, you may need to re-evaluate your plan and make changes. It's possible that you have identified the wrong function of the behavior or that the plan has not been run consistently.
We recommend running your behavior intervention for at least two weeks before making any changes to the plan. This is because oftentimes, behavior gets worse before it gets better. We often need a few weeks to see a true downward trend in a behavior. You can learn more about this below.
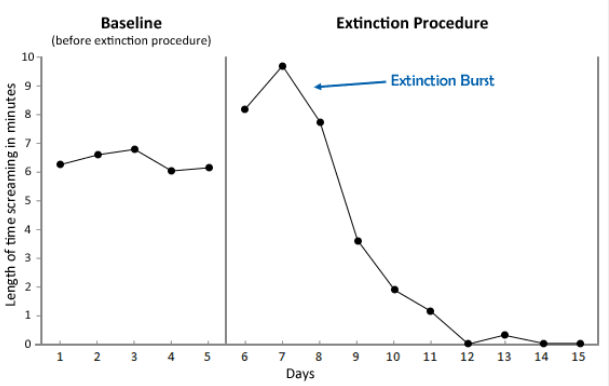
Extinction Bursts
Extinction is the discontinuing of reinforcement for a previously reinforced behavior. For example, a teacher no longer gives attention (which was reinforcing) to a student that talks out during instruction.
An extinction burst is an increase in the frequency of the problem behavior when extinction is initially implemented. Specifically, the problem behavior gets worse before it gets better. For example: During extinction, the student talks out even more (initially), then, the amount of talk outs decrease.
Why do Extinction Bursts Happen?
When you ignore a behavior that a student has done for a long time, it shouldn’t be surprising that the behavior will spike.
Example: Consider a 6th grader who, for his whole life, has whined anytime he wants something. When you suddenly ignore the whining, the student will be confused because he has previously always gotten what he wants from whining. As a result, the student will up the ante because he believes that if he whines more, he will eventually get what he wants. When he eventually learns that there is no pay off for whining anymore, the behavior will decrease. But right at the beginning, an excellent sign that the plan is working is an increase of behavior. You just need to stay consistent and “weather the storm” before it gets better.
What should the team do during extinction or an extinction burst?
The team should continue implementing the plan as designed. These areas should be discussed during initial behavior meetings as a team. If the team has a specific question about the problem behavior, please feel free to reach out to the JBAT team anytime
- Stick with the plan
- Reward the response you desire.
- IGNORE the behavior you want to reduce, to the extent that safety can be maintained.