Intro to the FBA
Functional Behavior Assessment
The purpose of a Functional Behavior Assessment (FBA) is to gather information about a student's problem behavior and determine why it is happening.
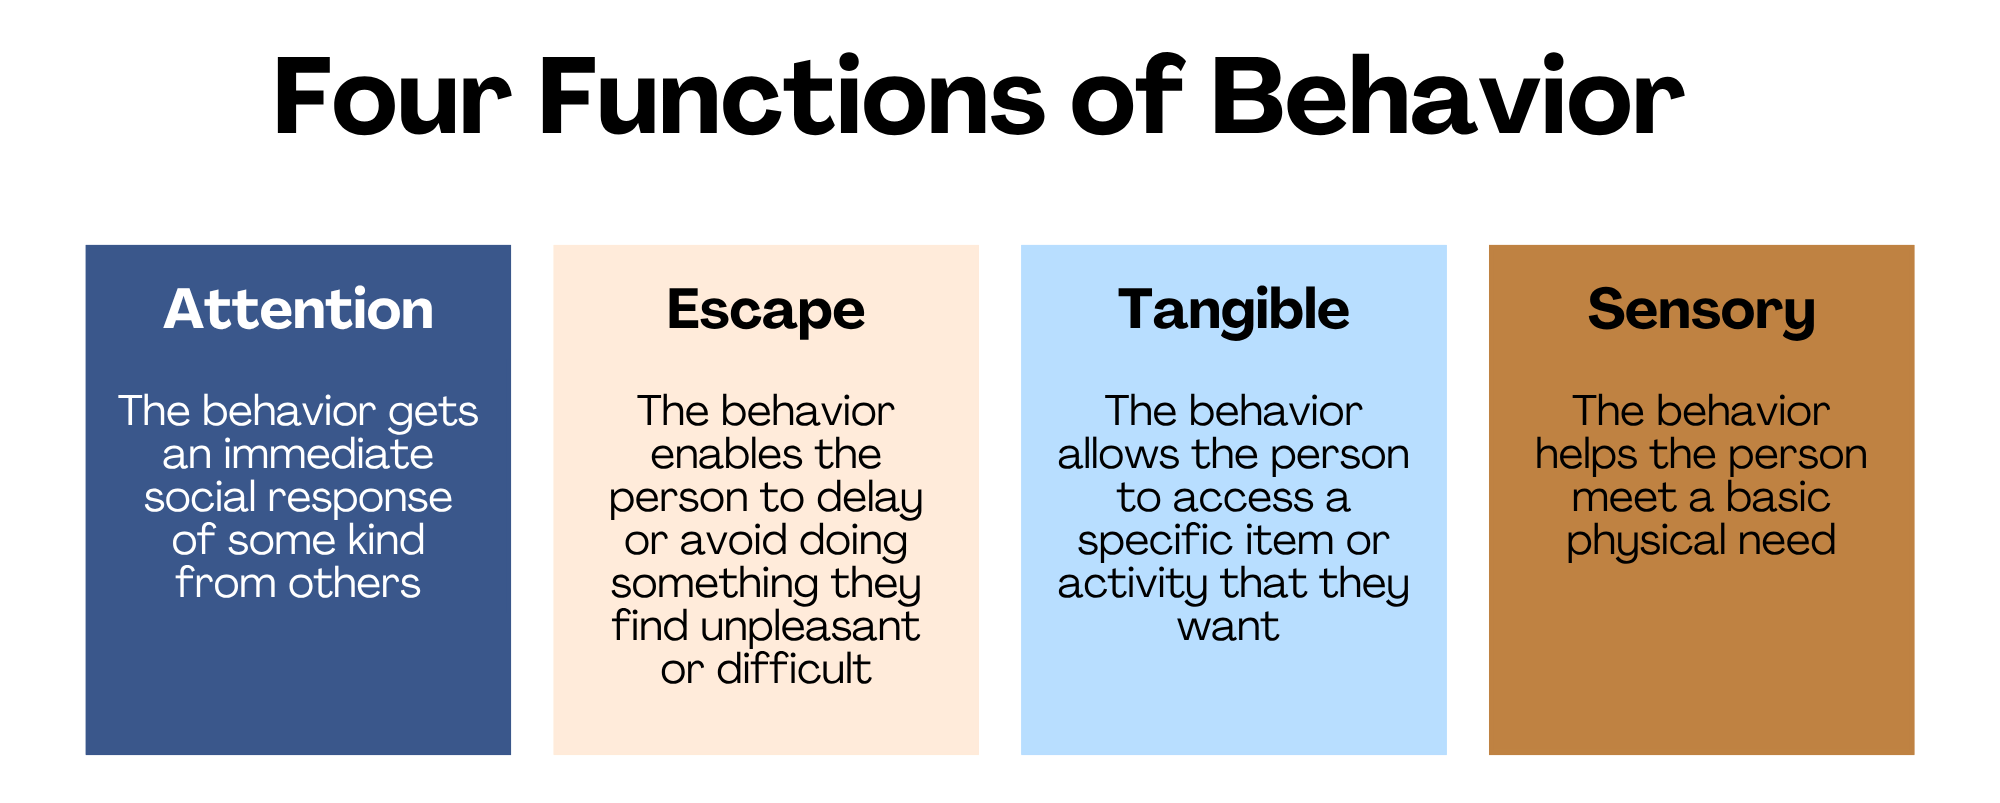
Throughout the process of creating an FBA, data is collected on a problem behavior. The results are then used to identify the function, or reason, behind the behavior. The four functions of behavior are Attention, Escape, Tangible, and Sensory. You can learn more about the functions of behavior on our Behavior Basics page.
The information from the FBA is then used to create a set of functionally-appropriate interventions called a Behavior Intervention Plan (BIP). The BIP will provide instruction and support so that the student's needs can be met in a safer and more socially appropriate way.
The following information follows the same format as the FBA form on Embrace. Use this as a reference when filling out the form for a particular student.
1. Strengths, Interests, and Reinforcers
1a. Student Strengths
Understanding a student's strengths allows us to build our plans more effectively. We can create a learning environment where a student's strengths overlap with areas in which they are struggling. This helps build momentum as a student learns to change their behavior and helps them feel more capable.
"Capturing information about the student’s strengths also allows the team the chance to discuss the student as a whole person first, rather than as a person defined by the struggles they are currently experiencing" (LRBI, 2023).

1b. Student Interests and Reinforcers
Like all humans, students need motivation in order to change their behavior! Finding rewards that are relevant to a student's interests can lead to a more effective BIP.
According to Dr. Greg Hanley, learning is easier in situations in which a student feels "happy, relaxed, and engaged." We refer to this state as "HRE." When a student is in HRE, we can bridge the gap between what they can and can't do. It becomes easier for them to engage in activities or situations where they might otherwise feel stressed or overwhelmed. Learn more about HRE in Dr. Hanley's article "A Perspective on Today's ABA."
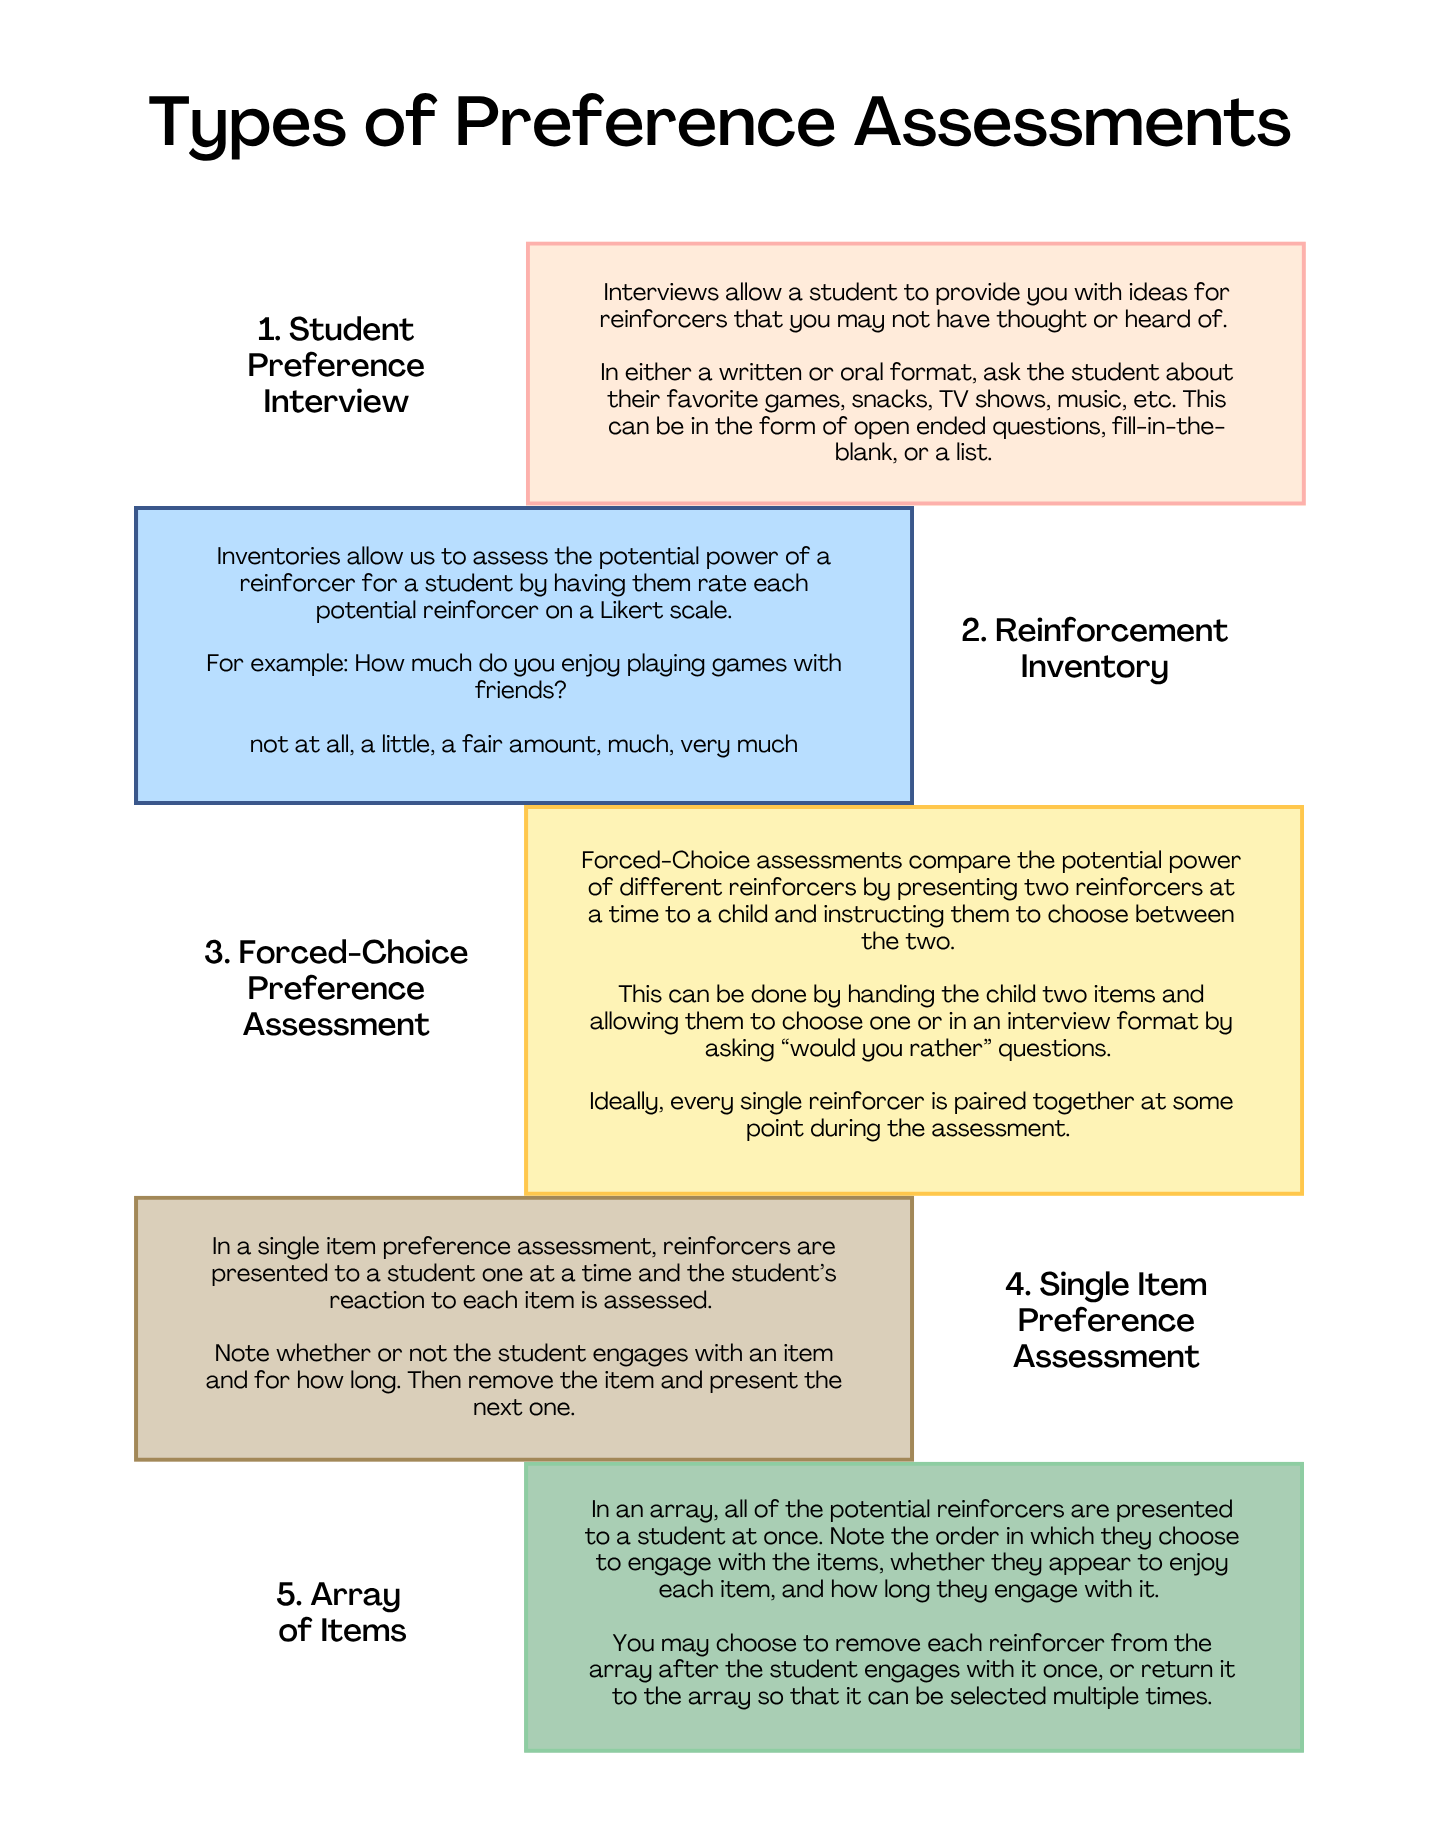
There are several ways to gather information about a student's interests, depending on their age, communication styles, and cognitive capabilities. Take a look at the visual below to decide which preference assessment(s) would work well for your student.
2. Problem Behavior
Before we begin to collect data on or analyze a problem behavior, we need to make sure that it is clearly defined.
An operational definition is an observable and measurable description of our problem behavior. This should describe exactly what the behavior looks like when your specific student engages in it. Any person unfamiliar with the student should be able to observe and measure the behavior based on your definition. Avoid making assumptions about the student's feelings or motivations, or anything else that can't be directly observed.
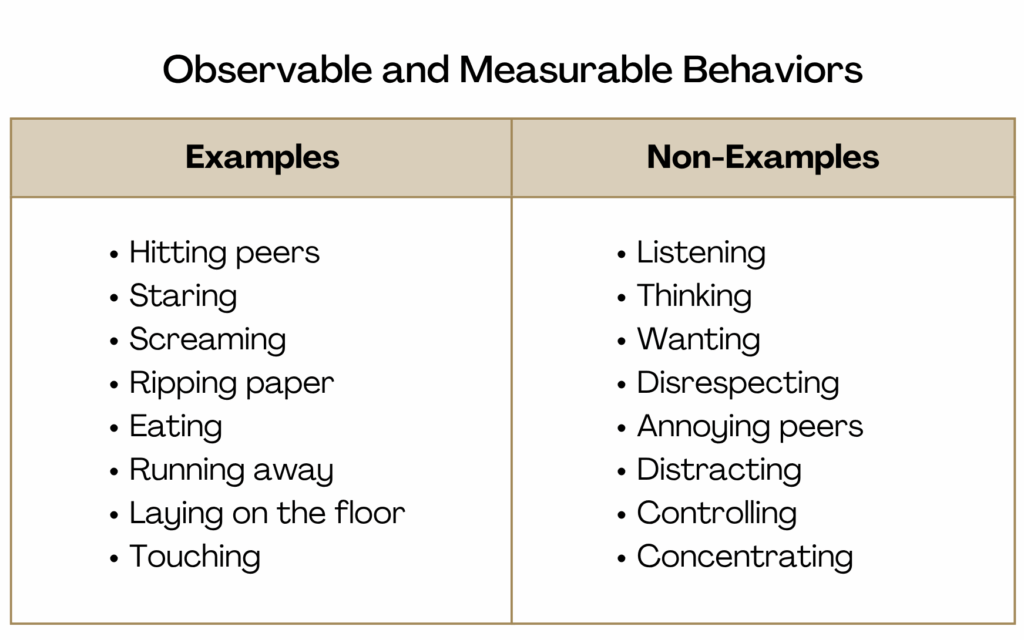
Example of observable and measurable behaviors could include "hitting" or "spitting." Words such as "disrespecting" or "antagonizing" are not observable behaviors and could represent a variety of different behaviors to different observers.
When creating an operational definition, include context and details that go beyond a simple one-word descriptor such as "aggression" or "noncompliance." A good definition includes both a general behavior category and specific behavior descriptors.
3. Baseline Data Sources
Baseline Data allows a team to capture a representative picture of a student's behavior. This data shows what a problem behavior looks before the implementation of a new or updated BIP, and the data can thus be compared to data from the new interventions to assess whether or not they are working.
It is recommended to collect at least 3 to 5 data points of baseline data to accurately represent a problem behavior.
Types of Baseline Data
Frequency
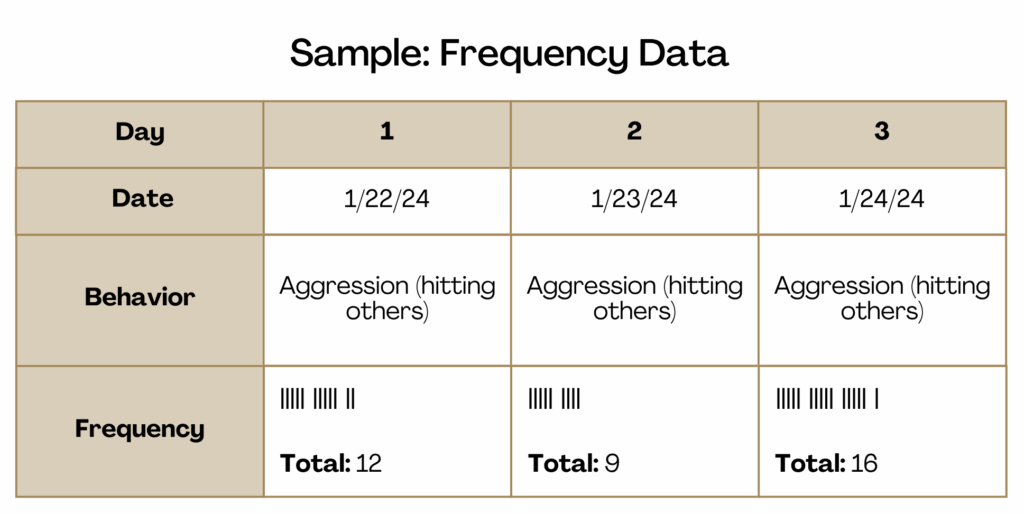
Frequency data counts how many times a target behavior occurs during a designated period of time. To collect this type of data, simply record a tally mark each time the behavior occurs.
Frequency data is recommended for behaviors that have a clear start and stop, and for behaviors that occur at a rate that an observer can keep up with. Examples of these behaviors may include physical aggression (such as hitting), and shouting out. For behaviors that occur at an extremely high rate, we recommend using a click counter or collecting duration data.
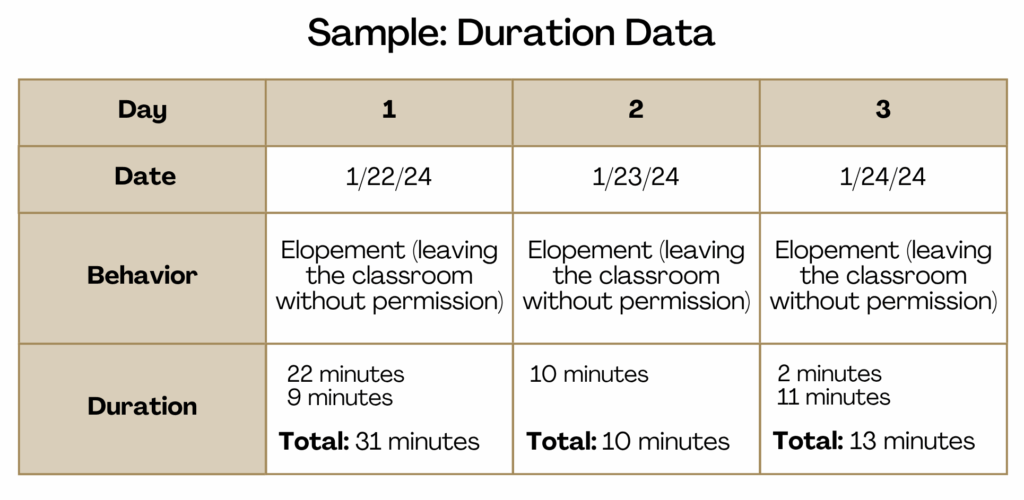
Duration
Duration data describes the length of time the target behavior occurs. To collect duration data, note the time a behavior begins and ends, and subtract the difference.
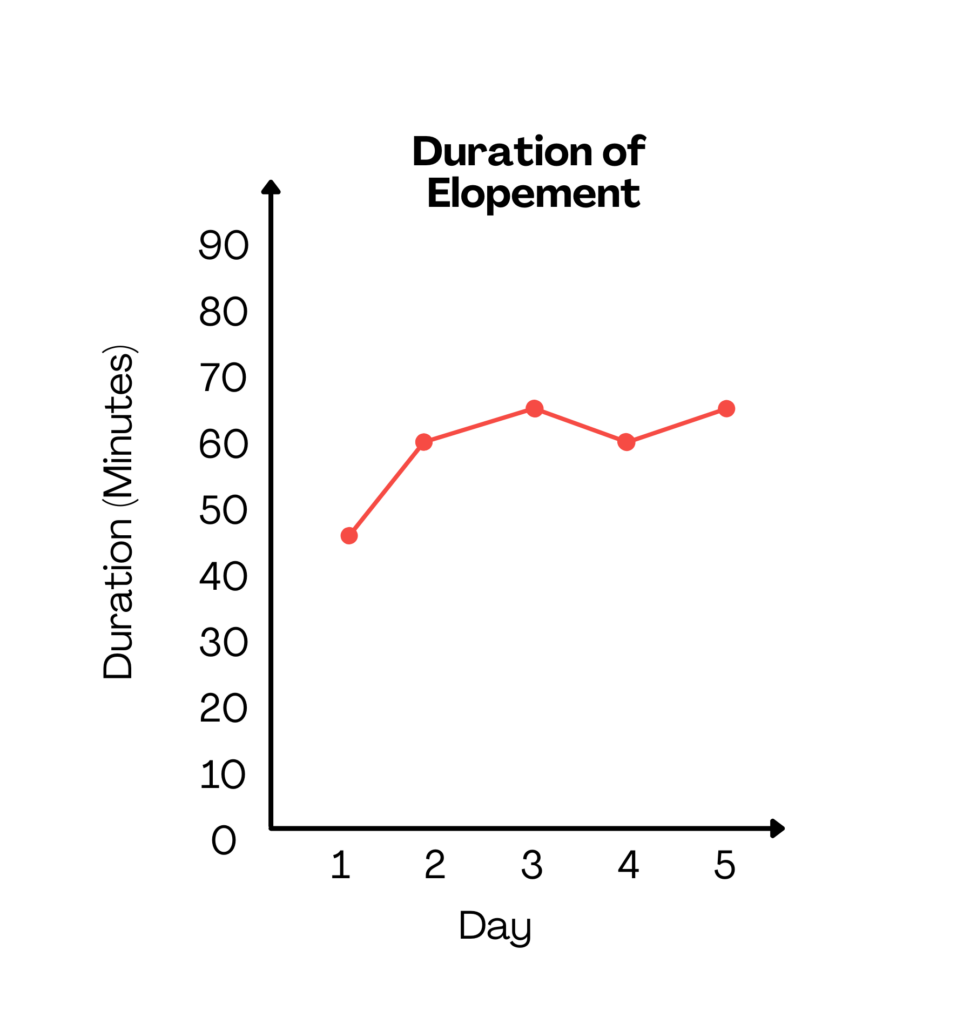
Collecting duration data is useful for behaviors that are non-discrete, such as noncompliance or elopement. This is because one occurrence of these behaviors could last anywhere from a matter of seconds, to minutes, to hours.
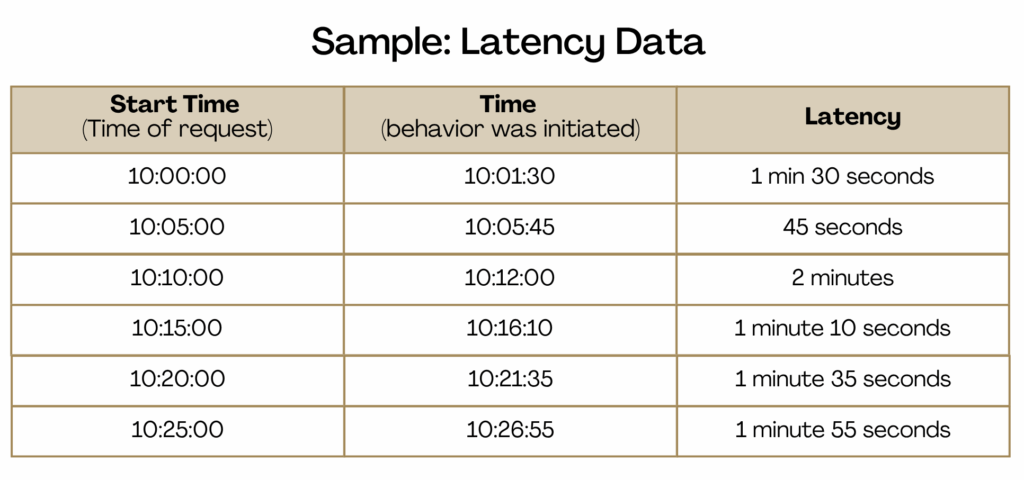
Latency
Latency data refers to the amount of time between an antecedent and when a student begins a specific behavior to understand how long it takes the student to respond.
To collect latency data, a team should already be aware of the antecedent and behavior they are monitoring. For example, you can measure the latency between a work demand and the onset of aggression. Be sure to document the type of antecedent or request that was presented, such as a specific level of prompting.
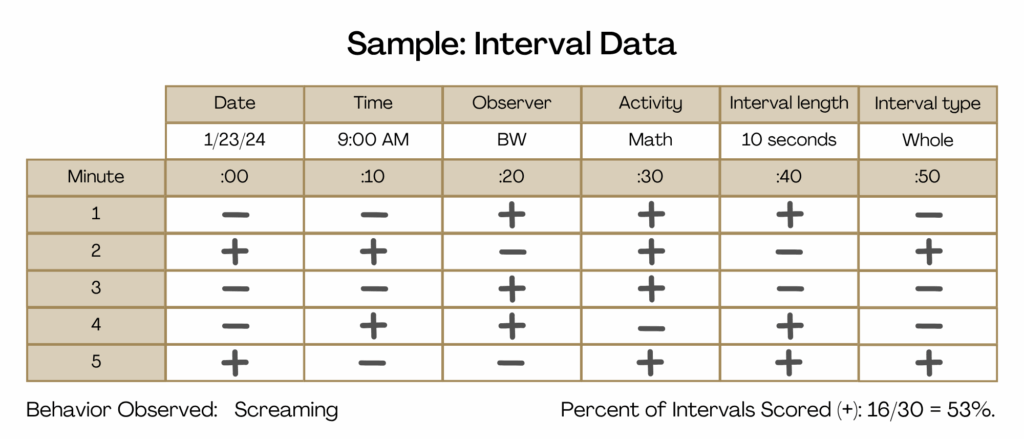
Interval Recording
Interval data involves dividing an observation into equal intervals of time and marking whether the problem behavior is present (+) or absent (-) during each interval.
Interval-based data collection simply provides an estimate of how often the behavior is occurring and is only able to tell us the percentage of intervals in which the behavior was observed. An interval length of 60 seconds or less is recommended in order to remain as accurate as possible.
The following are different forms of interval data collection:
- Whole-Interval Recording: score the interval with a (+) if the behavior occurred for the entire interval.
- Partial-Interval Recording: score the interval with a (+) if the behavior occurred at any time during the interval.
- Momentary Time Sampling: score the interval with a (+) if the behavior is occurring at the moment that the interval ends.
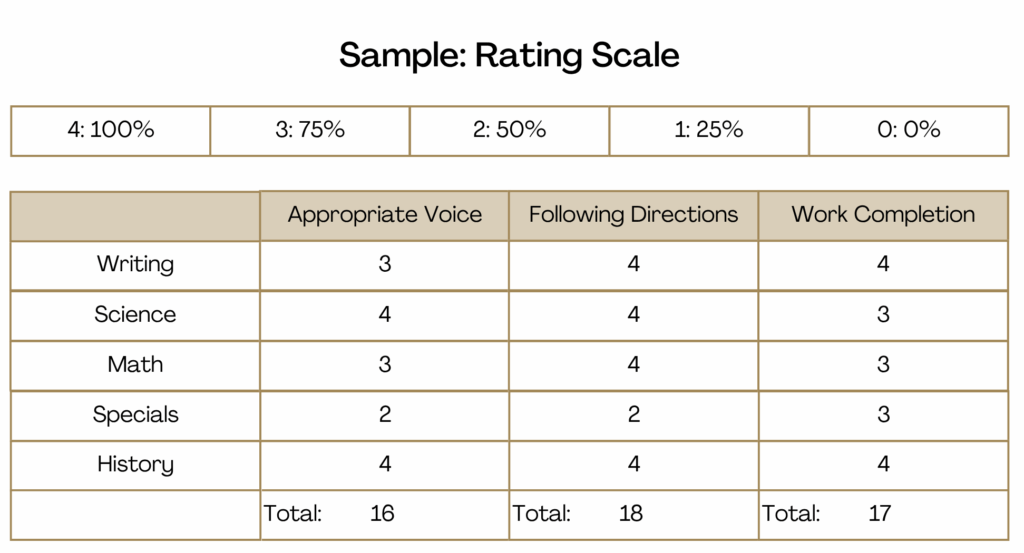
Rating Scales
A Rating scale is another way to estimate the overall occurrence of a behavior by using a simple Likert scale. It can track multiple behaviors at once and often tracks them over longer intervals of time, such as an entire class period. Therefore rating scales are an option that many teachers find easy to implement.
To set up a rating scale, predefine in observable and measurable terms what each point on the scale represents. Because this form of rating is subjective and different observers may disagree on their ratings, we recommend only one observer track a student's behavior over time.
4. Observation Data Sources
This section of the FBA involves uploading data on the student's problem behavior. It is useful to already be taking data on the behavior before beginning the process of creating an FBA.
There are two types of data measurement included in an FBA: direct and indirect.
4a. Direct Measurement
Direct measurement involves observing a behavior as it occurs and identifying the common antecedents and consequences of that behavior. Examples of of direct measurement include ABC Data and Scatter Plots. According to the LRBI, an FBA should include at least one direct measure of the problem behavior (LRBI, 2023).
We recommend collecting data during at least 3 to 5 sessions across multiple days in order to create an accurate picture of the problem behavior.
ABC Data Recording
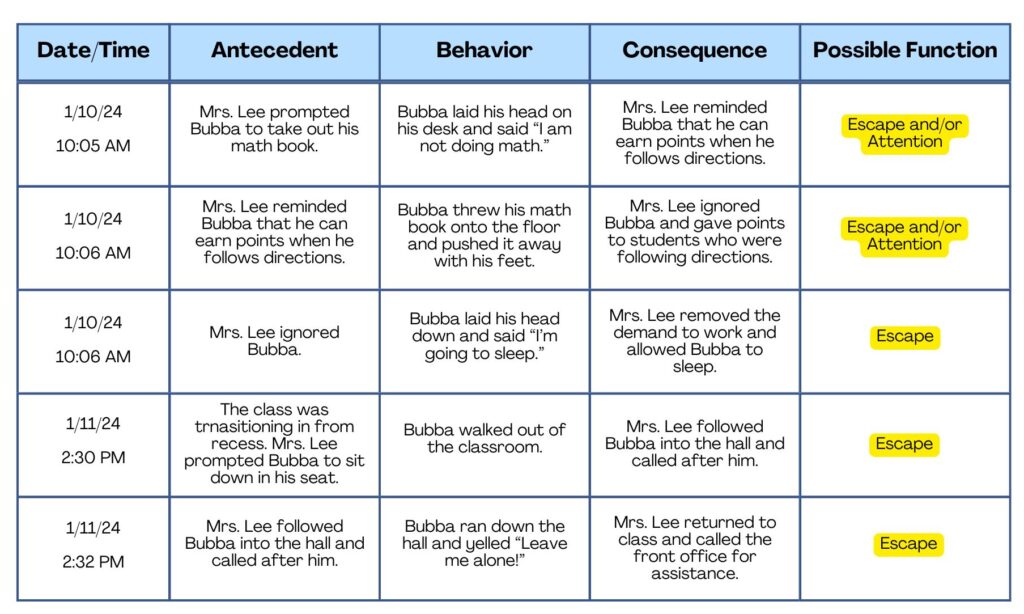
ABC data involves observing a student across various settings and taking notes about the following:
- A: The antecedents that come immediately before the behaviors
- B: An objective description of what the student's behaviors look like
- C: The consequences that come after the behaviors
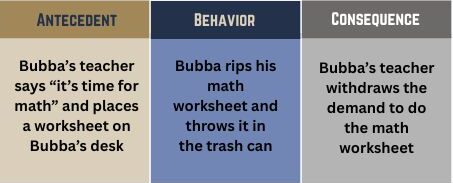
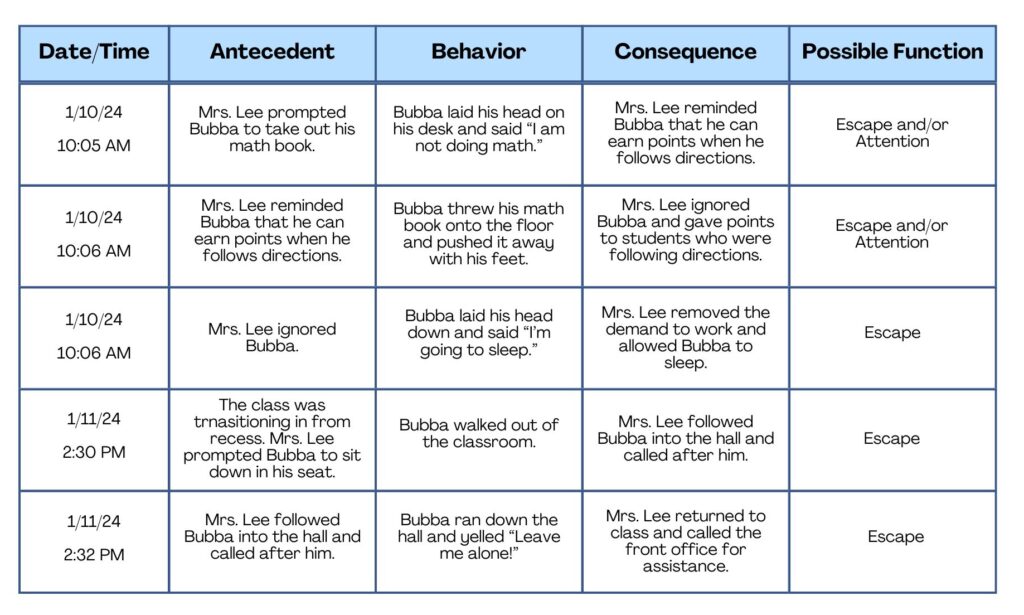
Taking ABC data across multiple days and settings can help a team identify common triggers for a student's problem behavior, as well as patterns in adults' responses to the problem behavior that may be inadvertently reinforcing it.
Below is a fictional example of ABC data collected on a student's problem behavior. Do you notice any similarities between different antecedents or consequences?
Scatter Plot Recording
If you are having a difficult time knowing when the behavior occurs so that you can plan to take ABC data, a scatter plot can help you get started.
A scatter plot is a visual representation of data that helps to identify trends and patterns in a student's behavior. This visual grid shows the relative frequency of one specific behavior across different times and settings, which helps a team to see when and where the behavior is most likely to occur. Times and activities are typically listed down one side of the grid while different dates are listed across the top, as shown below.
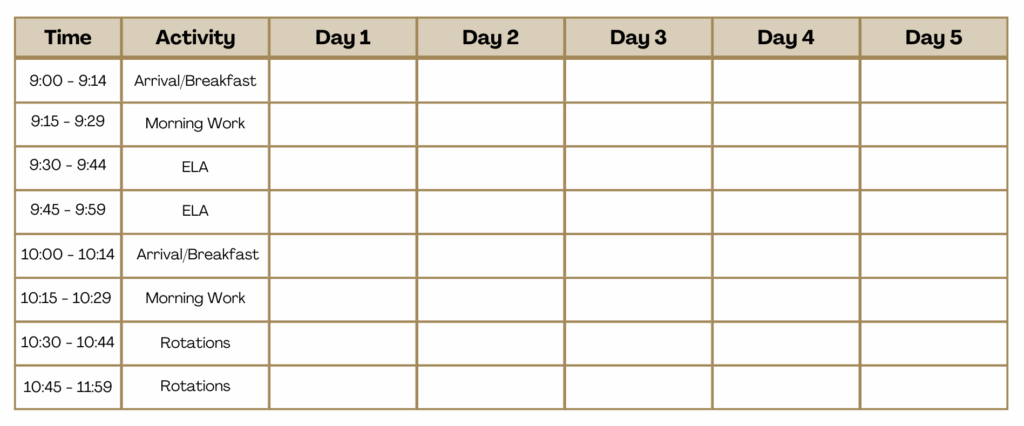
Occurrences of the problem behavior are then noted in the appropriate grid space. Typically, there is a visually system or legend that identifies low, medium, and high rates of behavior.
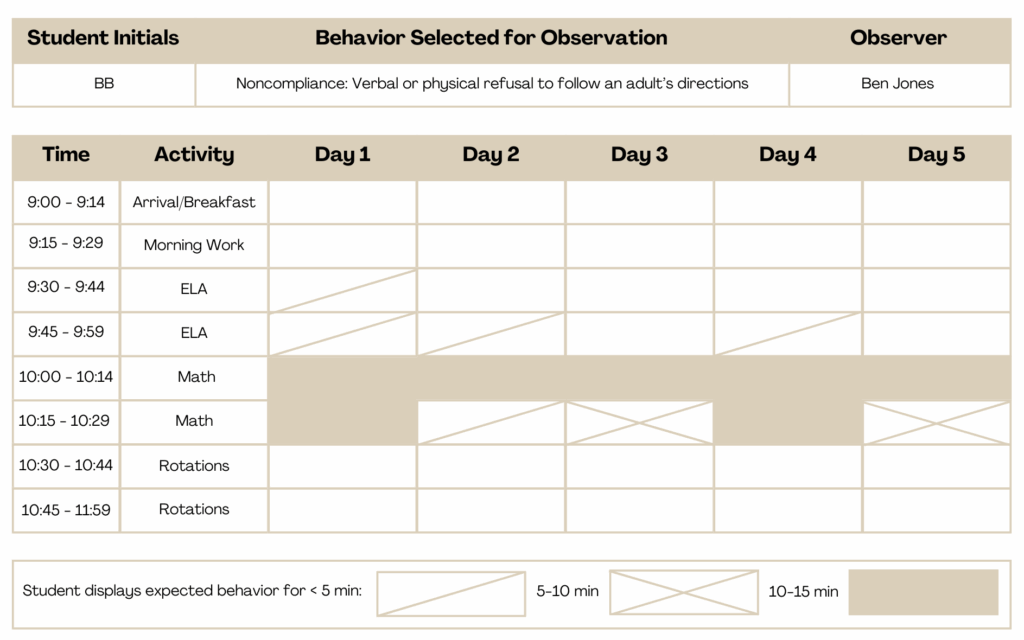
Below is a fictional example of a completed Scatter Plot recording. Are there any trends in the time of day that Bubba's noncompliance is occurring?
4b. Indirect Measurement
It is also beneficial to include indirect measurement of the problem behavior in the FBA. This refers to information that others recall or report on the behavior. Indirect measures do not involve firsthand observations, but they still aid in the assessment of what occurs before, during, and after the problem behavior.
Forms of indirect measurement include:
- Structured Interview
- Behavior Checklists
- Rating Scales
- Questionnaires
- Records Reviews
- Data Reviews
A structured interview is one of the most commonly used forms of indirect measurement, and can be given to various members of the student's team, as well as the student's parent or guardian. During this interview, ask an individual to describe a student's problem behavior and what it looks like, as well as the frequency, duration, and intensity of the behavior, common antecedents and consequences, and when and where the behavior is most likely to occur.

According to the LRBI, indirect measures should not be used as a substitute for direct measures (LRBI, 2023). They are more susceptible to error and can yield different results from one respondent to the next. Conducting these measures with multiple teammates can help to account for different points of view, instead of relying heavily on the experiences of one or two.
5. Results of the FBA
The main result from an FBA will be the formation of a Hypothesis Statement. The Hypothesis Statement is essentially a "best guess" as to why the behavior is occurring.
In order to create this Hypothesis Statement, we will summarize the information that we have gathered throughout the entire FBA process so far, including our baseline and observation data. We will identify the common antecedents and consequences for our behavior and finalize an operational definition.
After this, we should have a fairly good idea of the possible function of the problem behavior, or the reason why it is happening. When we put the ABCs of our problem behavior together with the function, we will form our Hypothesis Statement.
Below, we will guide you through each of these steps until you have created your own Hypothesis Statement.
Summarizing Baseline Data
The baseline data collected for a Functional Behavior Assessment will include all of the measurements of a student's problem behavior as discussed in the "Baseline Data Sources" section above.
Baseline data shows what a problem behavior looks before the implementation of a new or updated BIP. It will be compared to data from the intervention phase to assess whether or not the interventions are working. This data should be graphed using a line graph or bar chart and labeled as the "Baseline Phase."
Summarizing Observation Data
Take some time to analyze the observation data that you gathered through ABC recording, scatterplot recording, and indirect measures such as interviews or checklists.
Questions to ask when analyzing your data include:
- What time of day is this behavior most likely to occur?
- During which activities is this behavior most likely to occur?
- What adults or students are consistently around the student when the behavior is happening?
- What common triggers or antecedents can we identify during these times?
- What are common adult or student responses that may be consistently reinforcing the behavior when it is happening?
After analyzing your data, you should be able to identify the following:
- A clearly stated and refined operational definition
- A list of common antecedents that predict or trigger the problem behavior
- A list of the consequences that reinforce the problem behavior
Identifying Possible Function(s) of Behavior
After analyzing your observation data, your list of antecedents and consequences should give you a good hint as to the function(s) of your student's problem behavior.
Look back at your ABCs. What is the student obtaining or avoiding through the problem behavior? Which of the student's needs is being met?
Let's take a look back at Bubba's behaviors of noncompliance and elopement. While he may be receiving some attention by engaging in these behaviors, it appears that escape is the primary function.
Creating the Hypothesis Statement
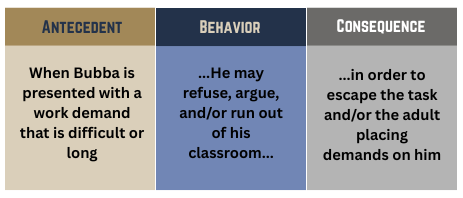
The Hypothesis Statement summarizes the "best guess" as to why the problem behavior is occurring. This statement should incorporate a description of the antecedent, behavior, and consequence, as well as the function of the behavior.
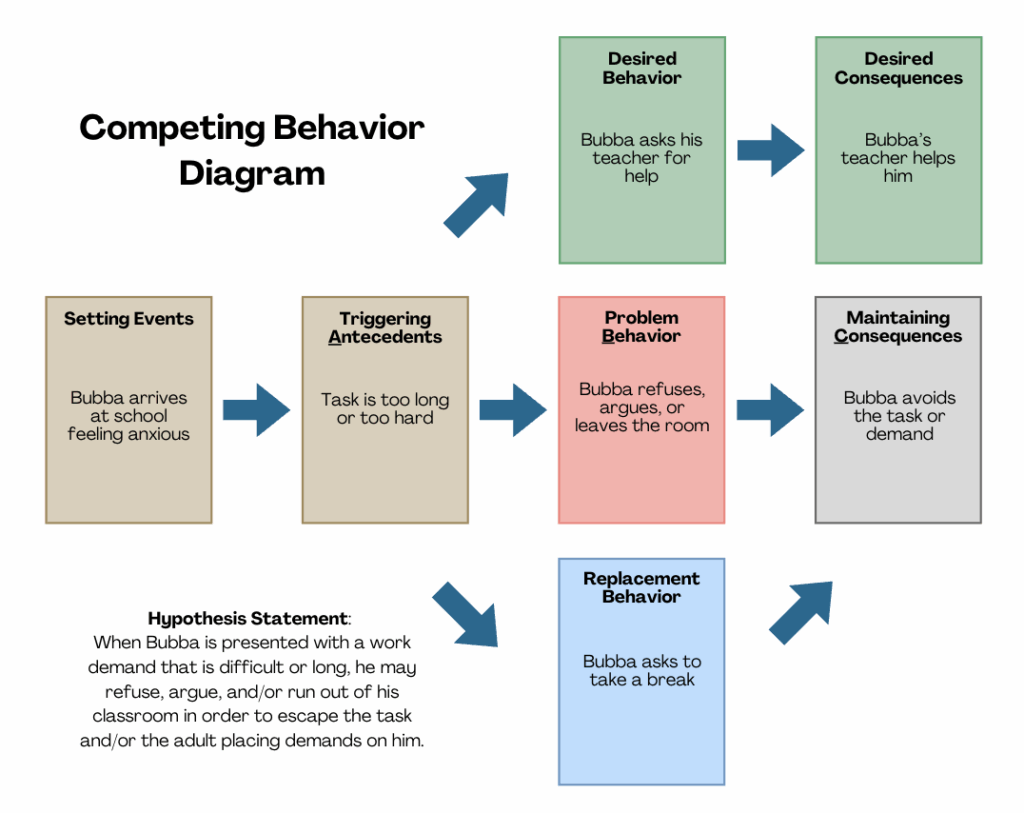
Example: When Bubba is presented with a work demand that is difficult or long, he may refuse, argue, and/or run out of his classroom in order to escape the task and/or the adult placing demands on him.
Replacement Behavior
Based on your hypothesis statement, choose an alternative replacement behavior. This will be taught to the student throughout the implementation of the BIP and represents the behavior that you want the student to engage in instead of the problem behavior. We want the student to be able to meet their needs in a safer and more appropriate way, so our replacement behavior MUST serve the same function as the problem behavior!
Example: Since the function of Bubba's noncompliance and elopement is escape, his replacement behavior should provide a way to escape. We can teach Bubba that in order to escape his task demands, he can ask to take a break. Therefore, Bubba learns that he does not need to refuse, argue, or leave the classroom in order for his needs to be met.
Preparing for the BIP
Create a Competing Behavior Diagram
We recommend using “The Competing Behavior Diagram” model below to visually describe the results of your functional assessment. This will help you create interventions that align with the information you have gathered. Click here for a downloadable copy of the Competing Behavior Diagram.
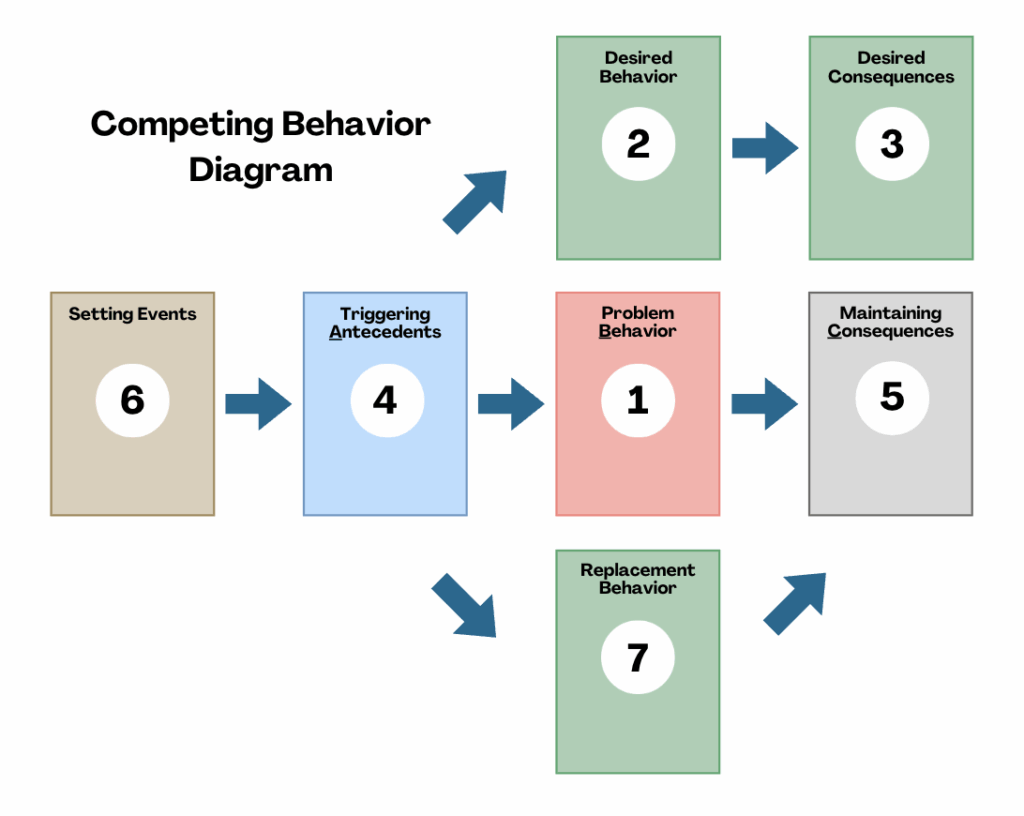
It is important to note that the replacement behavior is different from the desired behavior. The replacement behavior is a short-term alternative behavior that removes the student's need to engage in the problem behavior. The desired behavior is the behavior that we eventually want to see the student engage in after they learn the replacement behavior.
Take a look below at a sample Competing Behavior Diagram based on Bubba's behavior.
Once you have filled out a Competing Behavior Diagram, you are ready to begin planning strategies for your Behavior Intervention Plan!